Visualisation as a tool for discussion
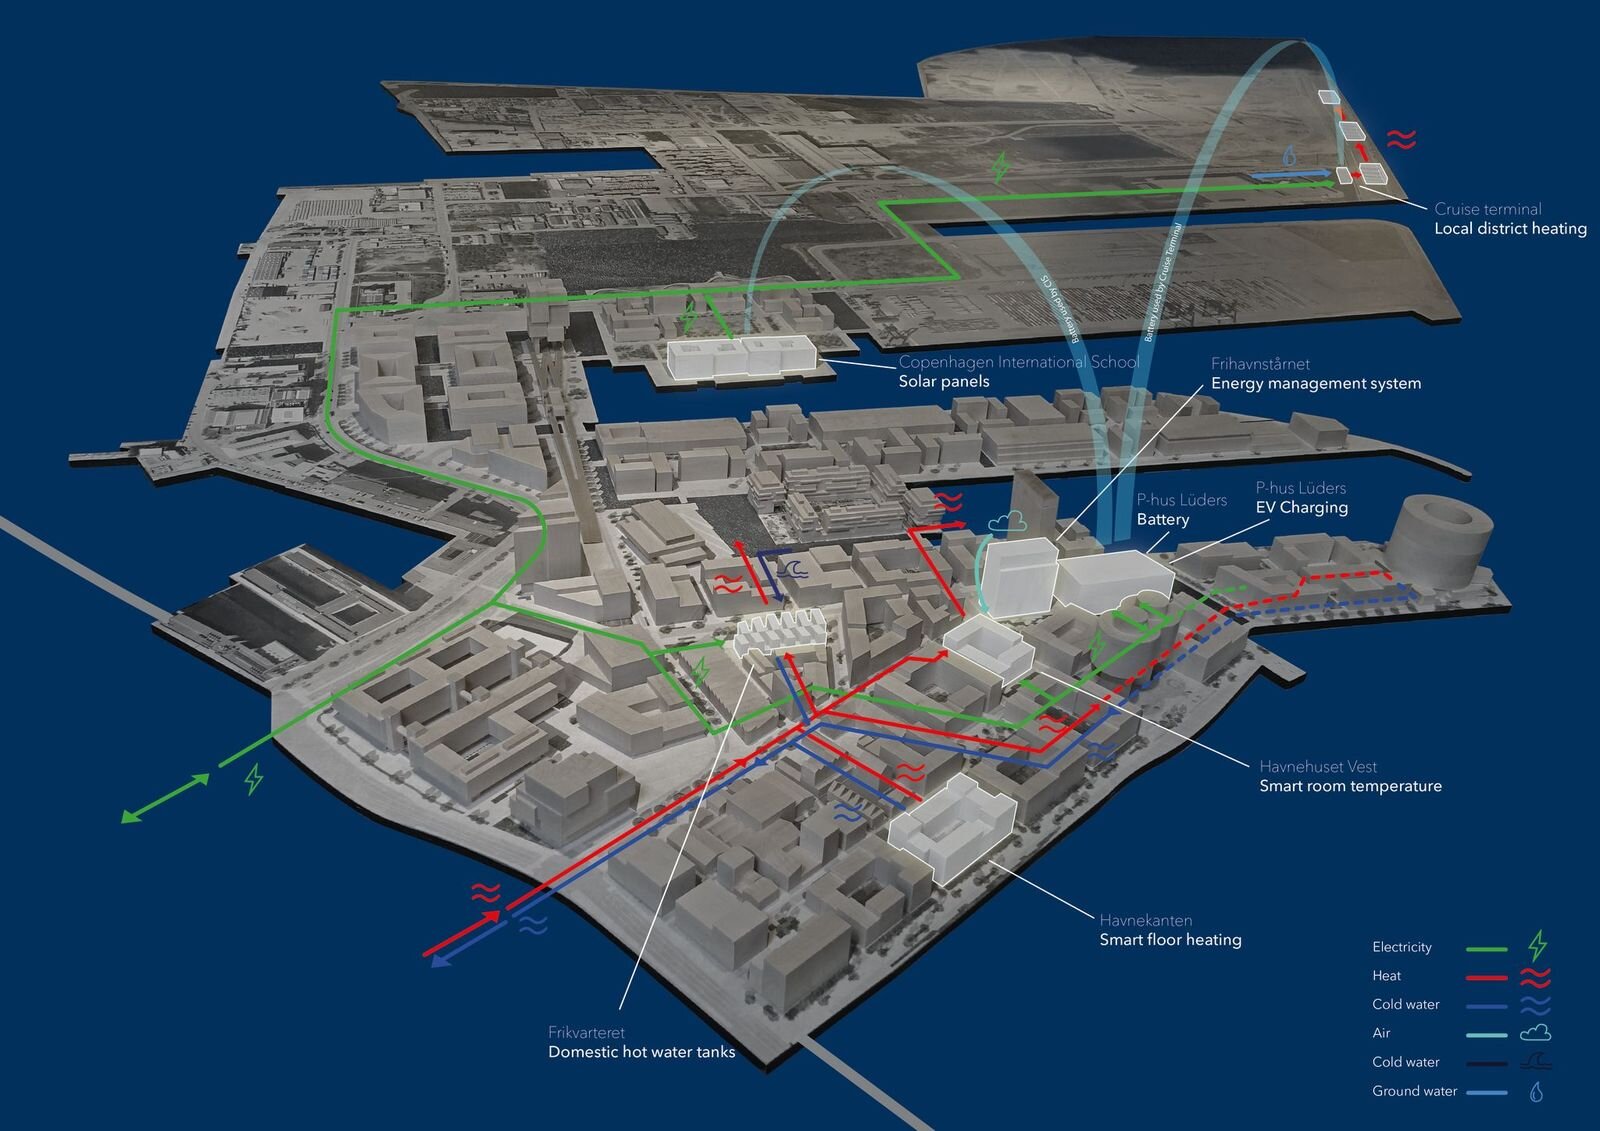
Being an integrated network for a new urban energy infrastructure, the concept developed at EnergyLab Nordhavn had to find an easy way to showcase how the concept would look when fully installed at Nordhavn urban area. A complex infrastructure consisting of many different sources and technologies had to be distilled into a communicative and visually understandable form, that could communicate with target groups and different stakeholders.
Challenge
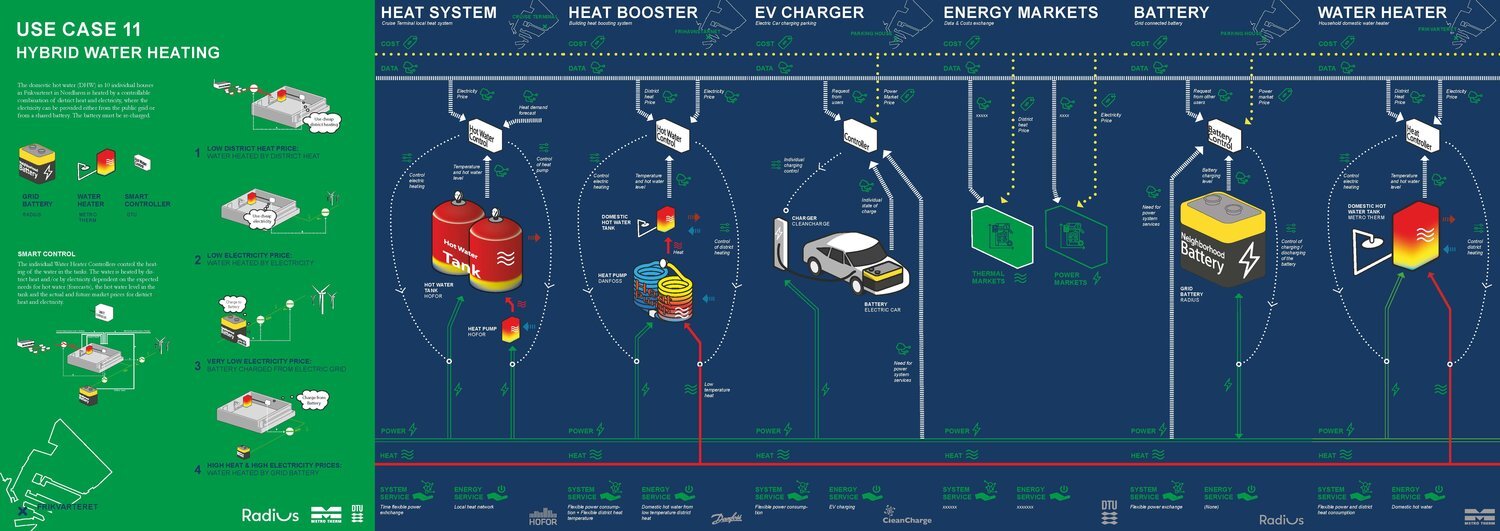
EnergyLab Nordhavn asked us to conceptualise and visualise four use cases that involved the concept of smart energy developed at EnergyLab Nordhavn. The use cases were meant as a tool to identify all the necessary elements for a demonstration of an integrated energy solution developed by EnergyLab Nordhavn.
Deliverables
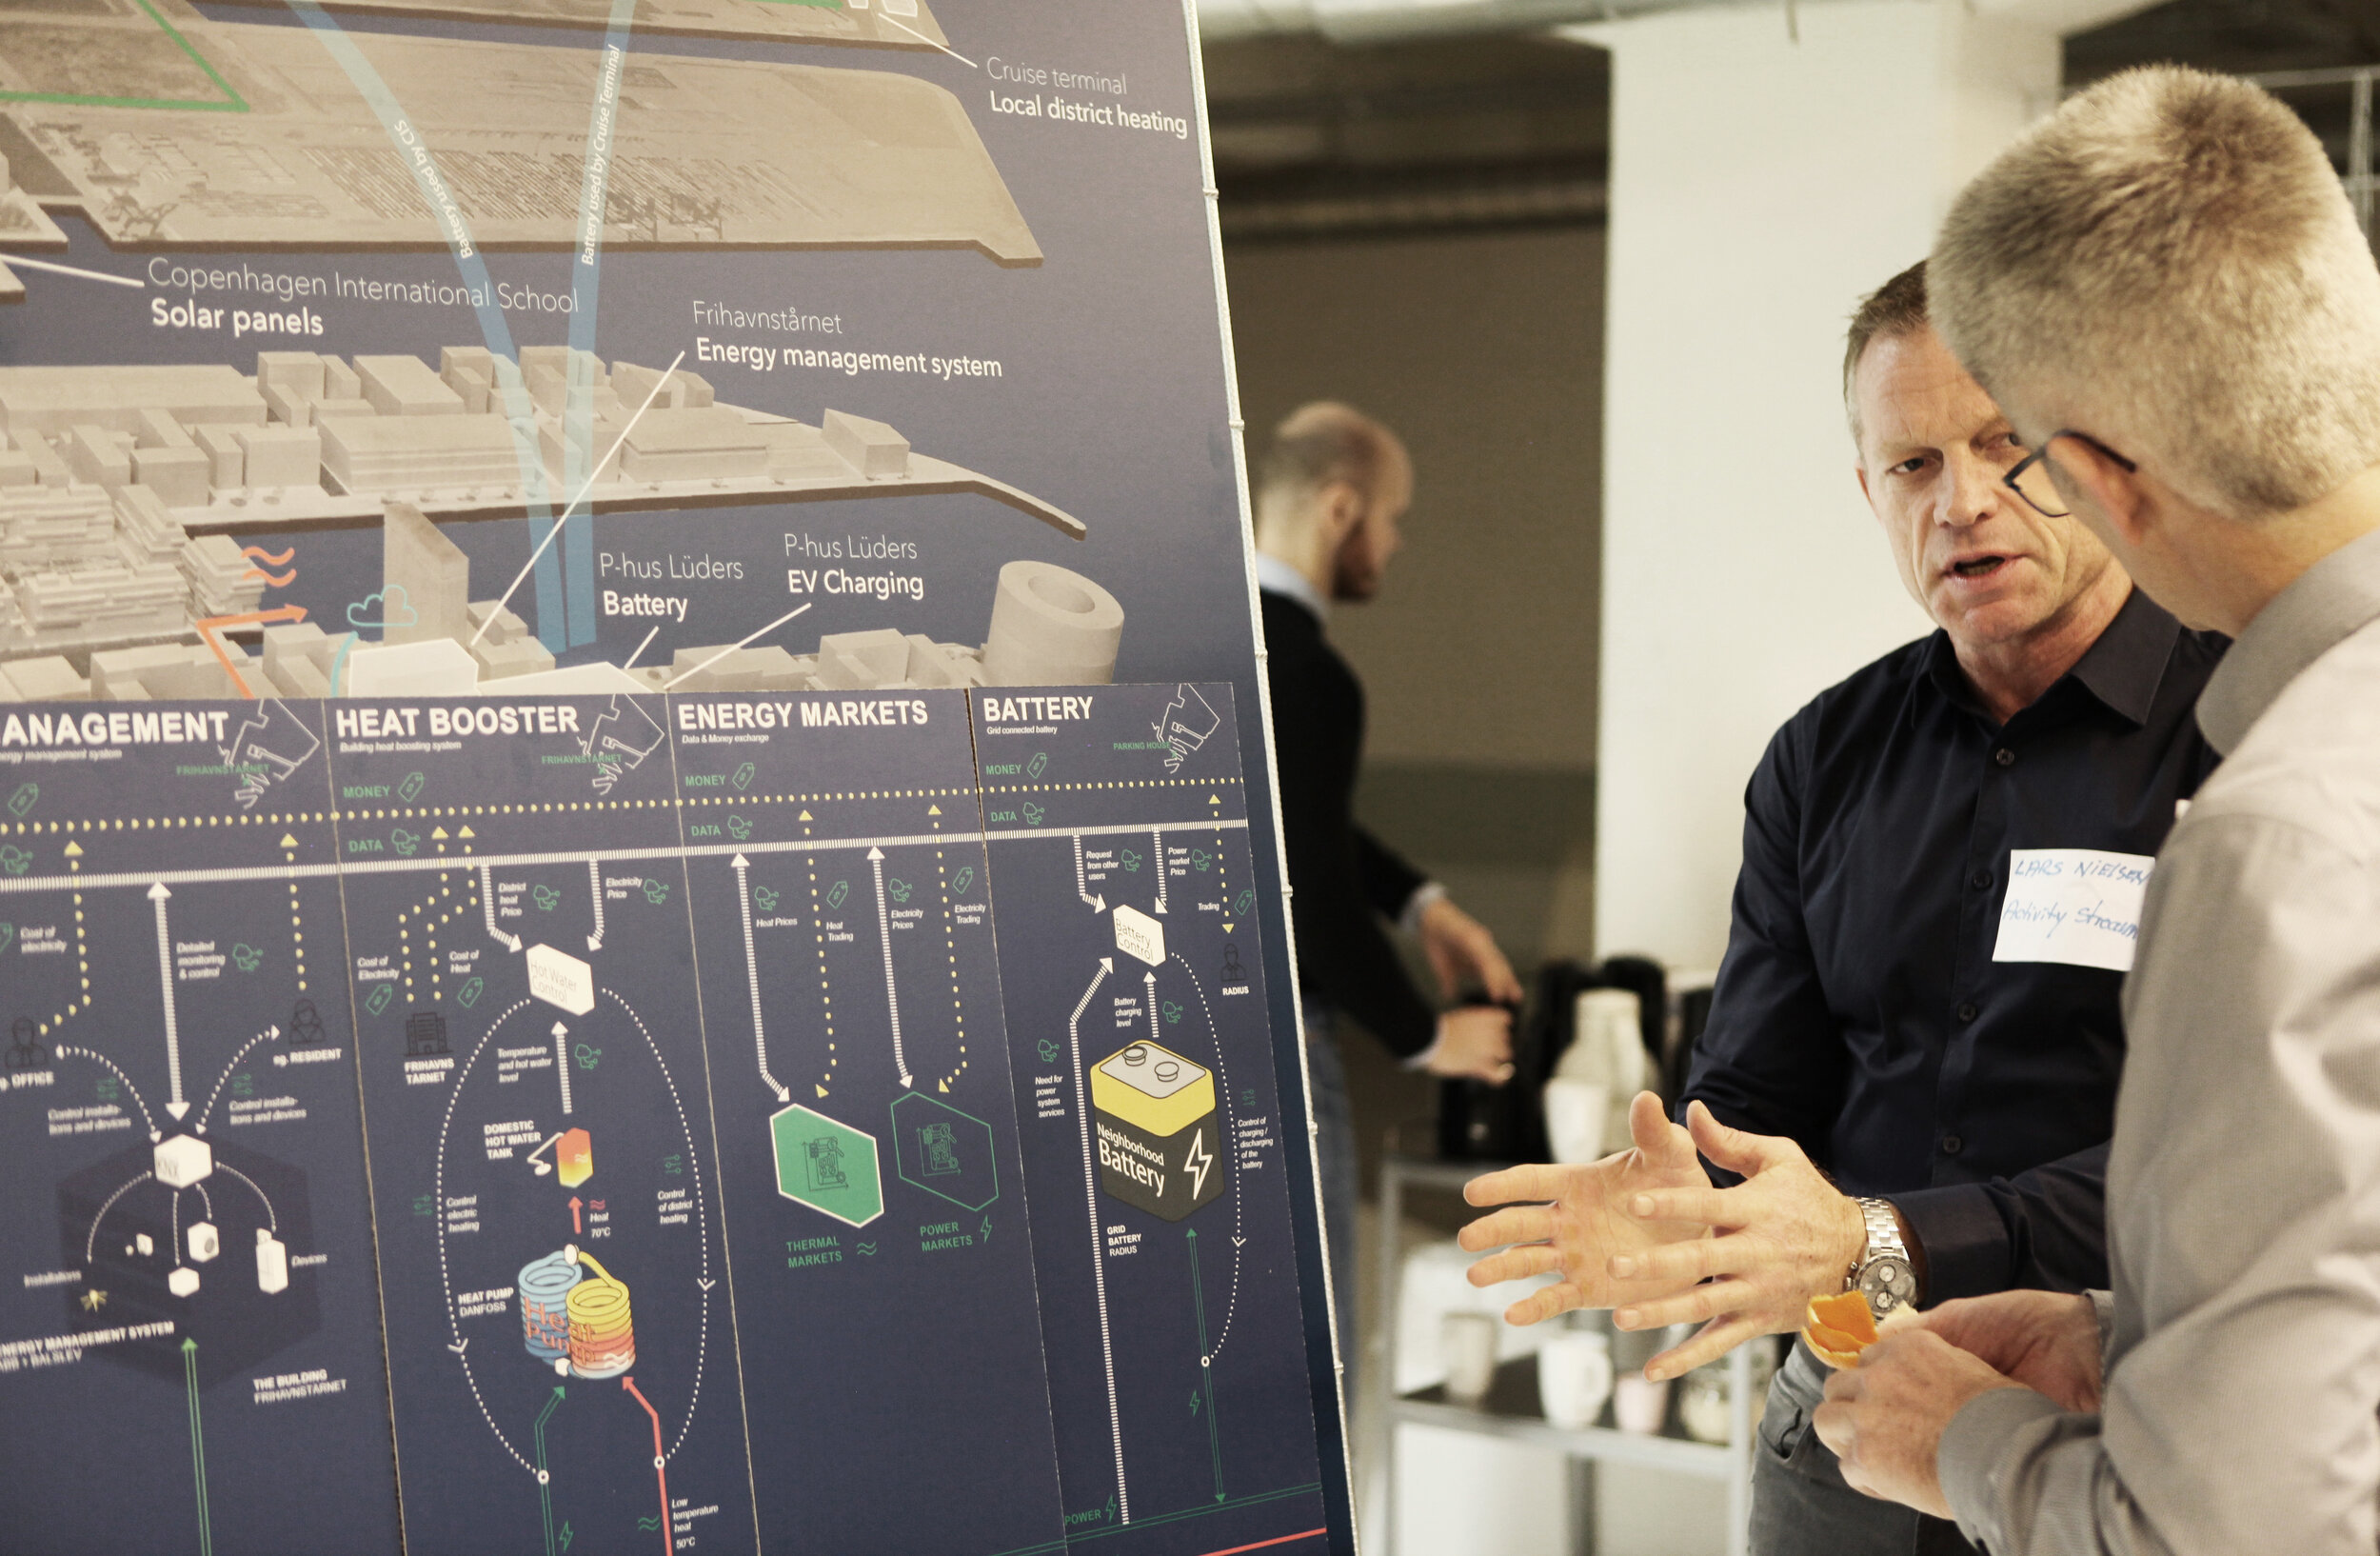
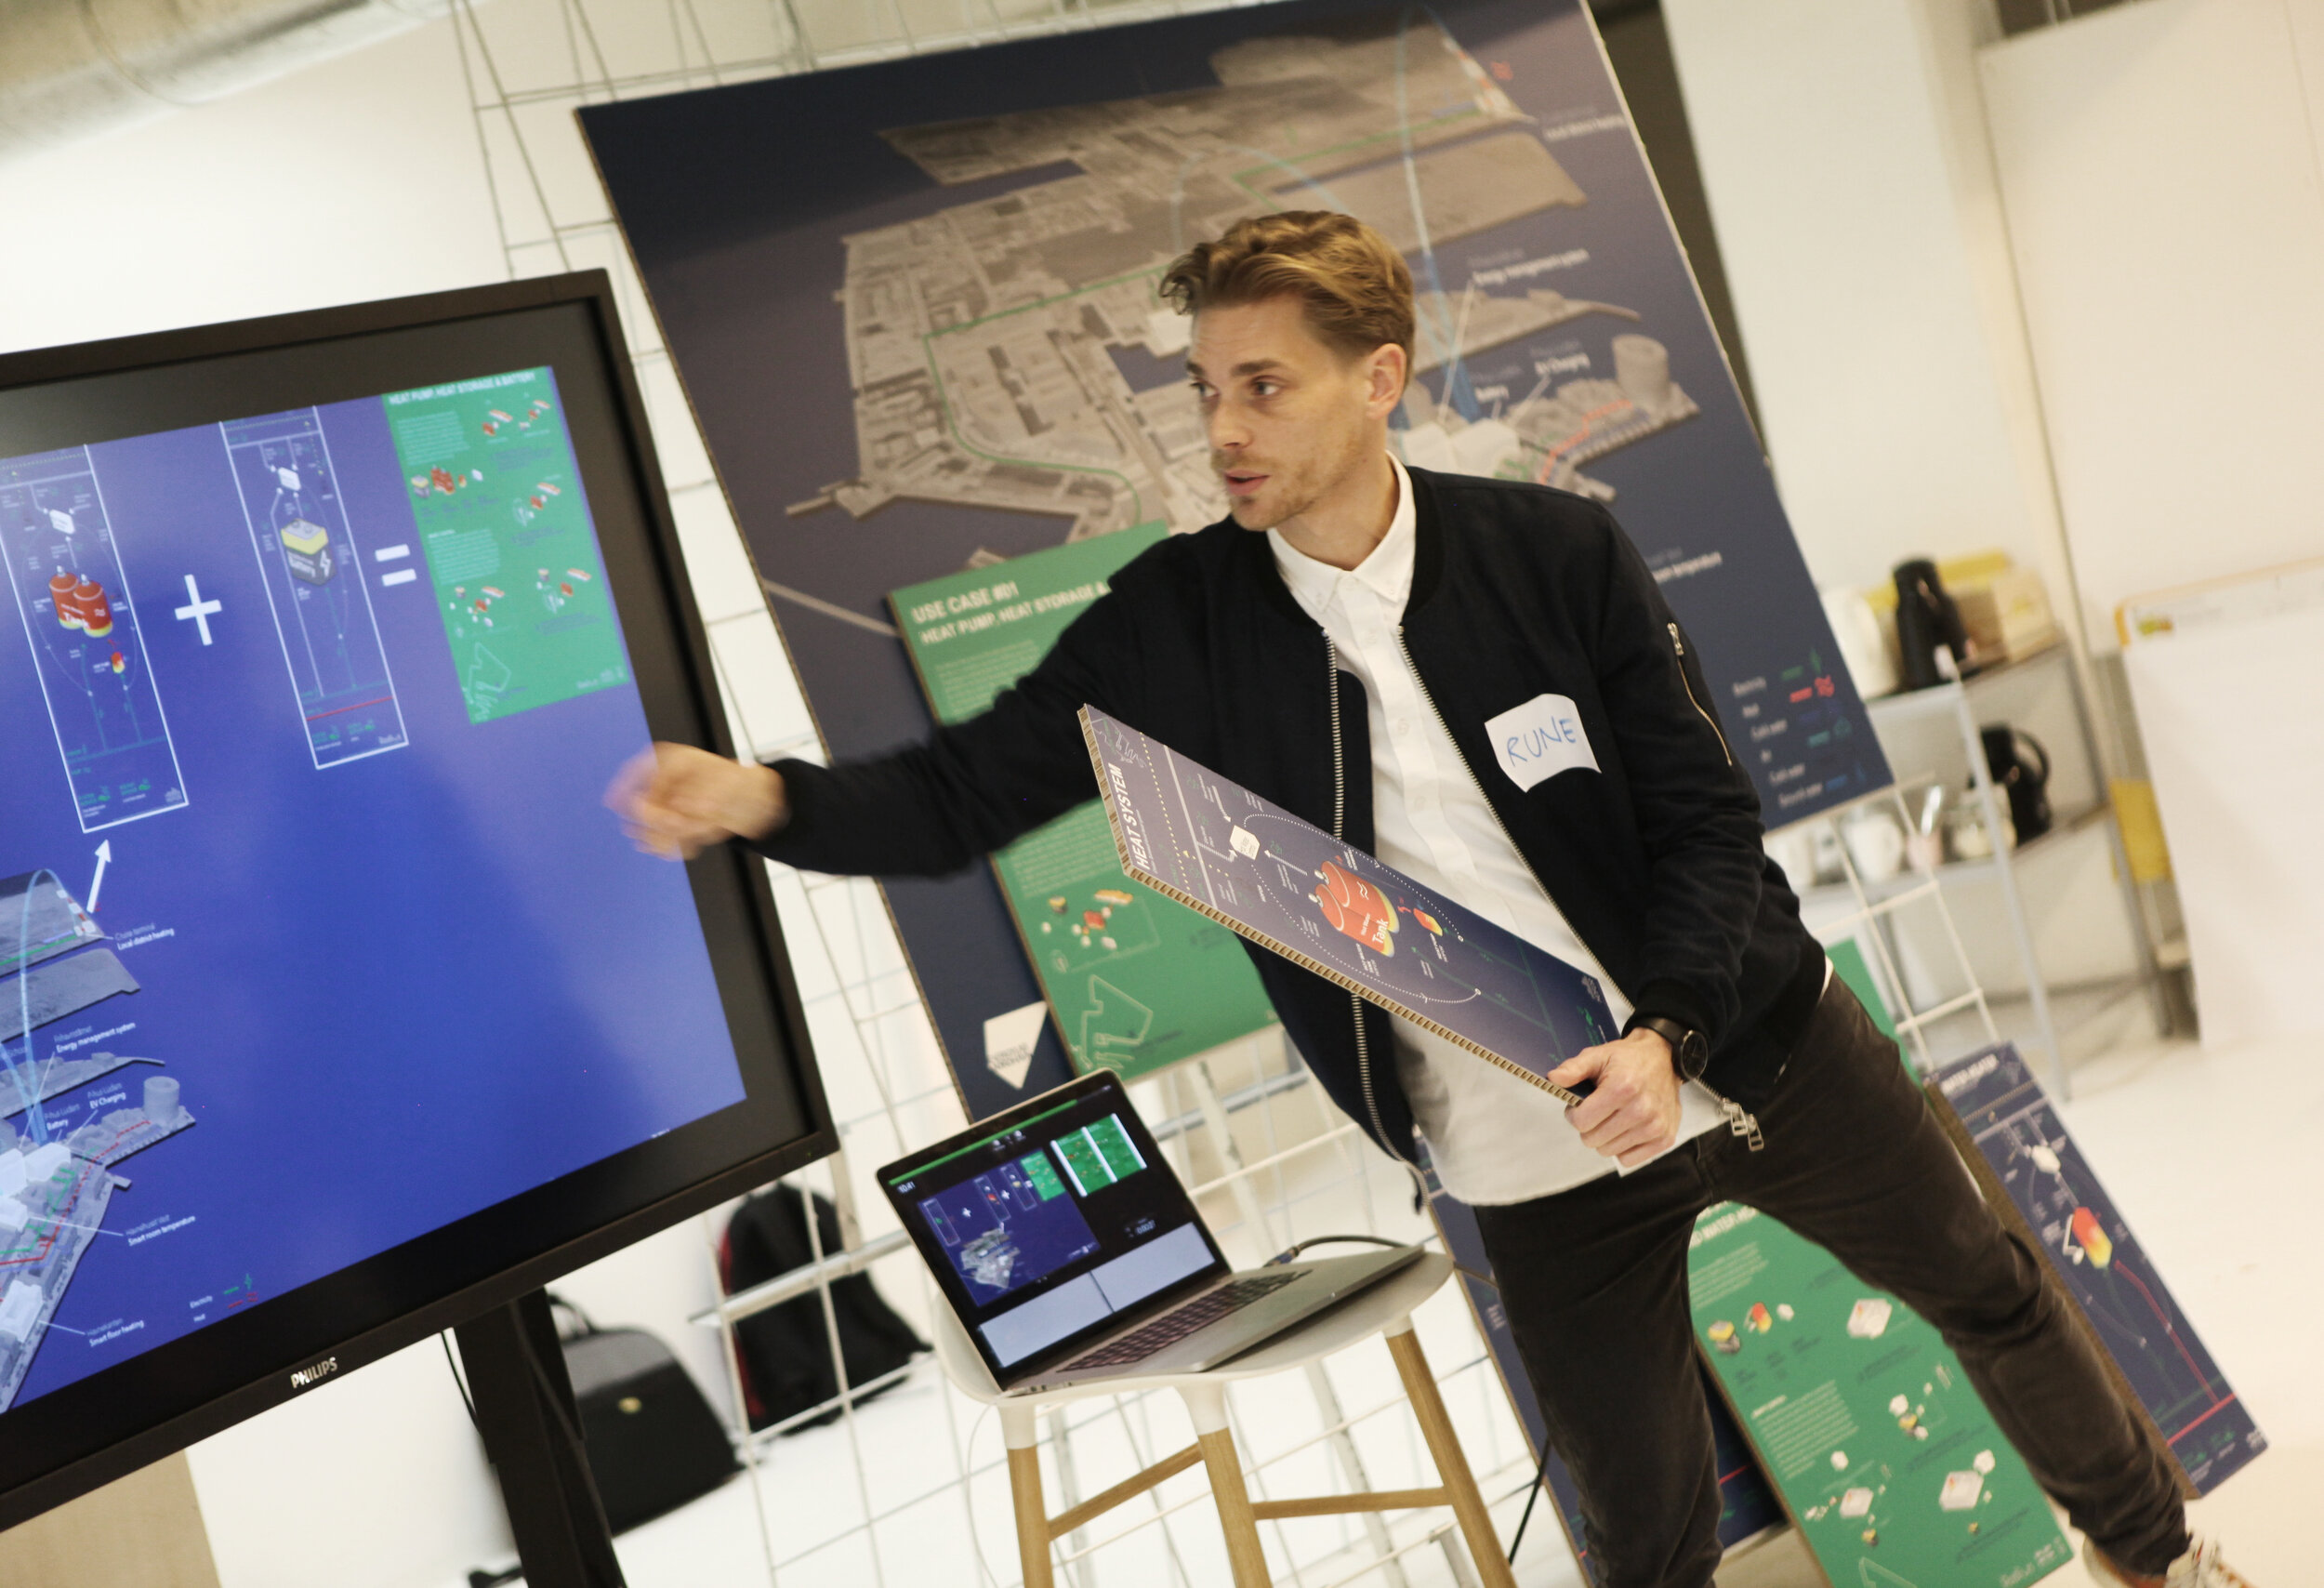
Big and dynamic infographics showcasing the different elements in use cases. The boards functioned as building blocks, with the ability to be switched into different configurations as a way of visualising new and different combinations.
We used the infographics to facilitate a workshop with the purpose of bringing ideas and input with regards to what the need for visualisation is in other smart energy cities.


